How to package risk datasets
This section describes common data formats and file types developed during a risk assessment. For each of the hazard, exposure, vulnerability and loss components, it describes possible grouping of multiple files into minimal resources associated with a dataset, which can make it easier to find and download resources of the same type.
The data structure and packaging of the output as obtained from the data analysts do not always align with the way we want users of the Risk Data Library to search and download data.
Data shared in risk catalogues (e.g. Risk Data Library Collection are provided as individual RESOURCES; it is encouraged to group these according to geography and theme:
GEOGRAPHY: data covering a multi-country region might be split into individual countries’ datasets.
THEME: for risk data, this includes hazard, sector or asset type. Depending on the project or intended purpose of the data, one or other grouping might be preferred.
We also need to consider:
FORMAT: how the data are stored. It is preferred to keep data in the same format in a single resource, or split different file formats into multiple resources. Read more about common data formats for risk information.
SELF-DEPENDENCY & COMPLETENESS: the data resource ought to be be easily interpreted and used by itself.
SIZE-EFFICIENCY: try to avoid creating large datasets (> 500MB) that would be hard to download on poor connections.
Caution
In general, splitting raster datasets into smaller parts is not advised, according to self-dependency and completeness criteria. For data efficiency, always consider a larger extent than needed as to avoid cross-border artefacts. Instead of splitting rasters, consider storing the raster in an alternative format that maybe more size-efficient (see Formats sections).
Structuring risk data well when it is generated and before it is delivered to a client is important to ensure data folder are intuitive to search, and make dataset upload more efficient (and it is easier to do first time than changing the structure later). Decisions on how to structure risk data ought to be be taken on a project-by-project basis, because there is a wide variety of how data are structured depending on the components of a project. For a country-scale analysis, we advise to follow the following structure of folders when preparing data for delivery / upload to a risk data catalog:
<country>_<project_name>
 ├── Hazard
 │   ├── <Hazard1> 	(example subfolders: hazard catalog, base data, hazard maps)
 │   └── <Hazard2>
 ├── Exposure
 │   ├── <Exposure1> 	(e.g., Residential buildings; Example subfolders: current exposure, projected exposure)
 │   └── <Exposure2>	(e.g., Transport infrastructure)
 ├── Vulnerability
 │   └── <Hazard1> X <Exposure1>
 │   └── <Hazard1> X <Exposure2>
 │   └── <Hazard2> X <Exposure1>
 │   └── <Hazard2> X <Exposure2>
 └── Loss
 │   ├── <Hazard1> X <Exposure1>	(subfolders for each sector loss; current and projected)
 │   └── <Hazard1> X <Exposure2>
 │   └── <Hazard2> X <Exposure1>
 │   └── <Hazard2> X <Exposure2>
Caution
Where there are many resources for a dataset, it can be tempting to include a folder structure in an online data catalog. This is not advised and it is suggested that files be grouped together into individual Resources in order to facilitate finding the specific component of analysis, and without creating problematically large file sizes.
Hazard data
Format / data types
Hazard data typically include hazard maps representing one or more historical events, or simulated probabilistic scenarios (event footprints). In some cases, hazard curves and stochastic event set tables are provided. Additional data could include intensity-duration-frequency curves, ground motion relationships, or hazard-defence measures.
Generally, hazard data (footprints) takes the form of raster (geospatial grid) data (GeoTIFF / COG), less often as vector data (gpkg, shp). Supporting data (hazard curves, historical catalogue) could come as tables (csv, xlsx) or vector data (gpkg, shp).

Example: two kinds of representation for the same hazard (tropical cyclones - strong winds) over the Caribbean:
- Raster data (left): max wind speed from probabilistic scenario (Return Period 100 years);
- Vector data (right): max wind speed from empirical events recorded in 40 years period (1980-2020).
Thematic grouping
The main thematic groupings in hazard data are:
Hazard type: data produced for seismic hazard, wildfire, fluvial flood, pluvial flood, etc.
Reference period: e.g., historical, projections (2050, 2080)
Geographic grouping
Scale, location and resolution: Hazard data can be generated at global, regional, national, subnational, or urban level. High-resolution hazard data (e.g. urban level analysis) might be grouped for individual locations (city) whenever the dataset becomes too large.
Packaging suggestion
We suggest grouping hazard data using the following hierarchy:
Hazard type
Geographic scale and location
Reference period
For example:
<project_name>
 └── Hazard
     ├── <Hazard1>
     │  ├── <Country1>
     │  │  ├── <Historical>
     │  │  │  └── Resource: <project_name>_<Hazard1>_<Country1>_<Historical>.zip  ->  [RP10.tif; RP25.tif; RP50.tif; RP100.tif]
     │  │  ├── <2050>
     │  │  │  └── Resource: <project_name>_<Hazard1>_<Country1>_<2050>.zip  ->  [RP10.tif; RP25.tif; RP50.tif; RP100.tif]
     │  │  └── <2080>
     │  │     └── <...>
     │  └── <Country2>
     └── <Hazard2>
        ├── <...>
        └── <...>
Exposure data
Format
Exposure data typically describe the location, characteristics and value of individual assets or an aggregated number of assets/population per grid cell. Each point or cell usually has many attributes associated with it.
Exposure geospatial data can take the form of vector (gpkg, shp), or raster (GeoTIFF / COG). In some cases, exposure comes as table (csv, xls).

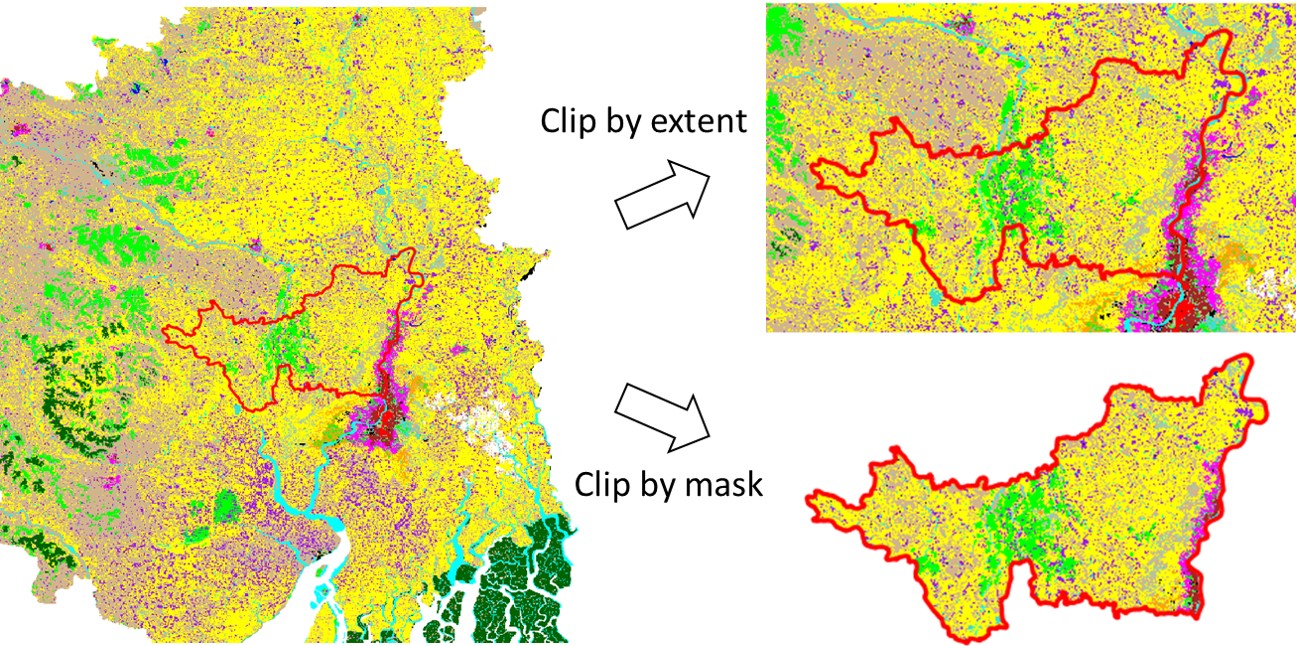
Example: two kinds of exposure representation for the same area (Dhaka, Bangladesh):
- Raster data (left): presence of built-up as binary raster layer at 10 meter resolution, derived from remote sensing (World Settlement Footprint 2019). Does not discriminate the building types;
- Vector data (right): vector area of individual buildings from Open Street Map, 2023. Does discriminate between building types.
Thematic grouping
The main thematic groupings in exposure data are:
Exposure category: e.g. Population / Built-up / Cropland
Sub-type: e.g. Built-up asset type (Structure, Content, Product) / sector (Residential, Commercial) / construction type (Masonry, Wood e.g. Population gender (male, female) / Age distribution (children; over 65)
Year: reference period or year, e.g. specific year (2020), projected period (2040-2060), etc.
Geographic grouping
Scale, location and resolution: Exposure data can be generated at global, regional, national, subnational, or urban level. High-resolution hazard data (e.g. urban level) might be grouped for individual locations (city) whenever the dataset becomes too large.
Packaging suggestion
We suggest grouping exposure data using the following hierarchy:
Geographic scale and location
Exposure category
Year
Sub-type (optional)
For example:
<project_name>
 └── Exposure
    ├── <Country1>
    │  ├── <Exposure_categoryl>
    │  │  ├── <2020>
    │  │  │  └── Resource: <project_name>_<Hazard1>_<Country1>_<Exposure_categoryl>_<2020>.zip  ->  [subtype1.tif; subtype2.tif; subtype3.tif]
    │  │  └── <2050>
    │  │     └── Resource: <project_name>_<Hazard1>_<Country1>_<Exposure_category1>_<2050>.zip  ->  [subtype1.tif; subtype2.tif; subtype3.tif]
    │  ├── <Exposure_category2>
    │  │  └── <...>
    └── <Country2>
        └── <Exposure2>
           └── <...>
Vulnerability data
Format
Vulnerability data are usually provided as table data (csv, xls) or json containing the impact model function and parameters.
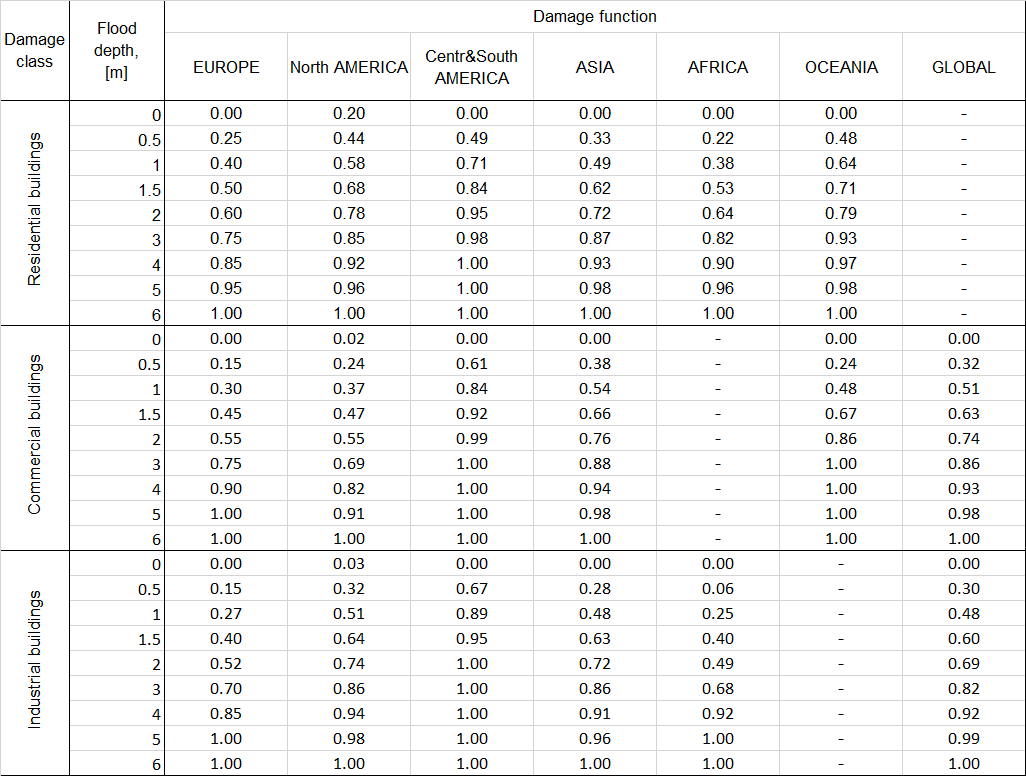
Example of vulnerability functions for floods (depth-damage curve) as table data (Download).
Often, vulnerability models are proprietary data and only shared as pictures; this has low reusability and ought to be avoided. Always try to obtain a mathematical description for this component.
Thematic grouping
The main thematic groupings specific to vulnerability data are:
Hazard type: e.g. Flood damage function; Earthquake fragility curves.
Exposure type and sub-type: e.g. Builtup (Structure, Content, Product / Residential, Commercial / Masonry, Wood)
Geographic grouping
Vulnerability curves can be developed for individual countries or environments within a project. Where this is the case, this grouping ought to be retained.
Packaging suggestion
We suggest to group exposure data using the following hierarchy:
Hazard type
Geographic (unless global function, one resource per country)
Exposure category (Population, Built-up, …)
Sub-type (e.g. sector (Residential, Commercial), construction type (Masonry, Wood), or others)
Note
This hierarchy can be maintained also when packing all the data in one file (e.g. multiple csvs into one excel file), which is advised unless specifically demanded by the data use (e.g. data are formatted for usage into a specific model).

Example of multiple vulnerability functions for floods (depth-damage curve) into one excel file (Source: JRC).
For example, when grouping multiple functions into one excel file, the following approach can be adopted:
<project_name>
 └── Vulnerability
    ├── <Hazard1>
    │  ├── <Country> (skip if global function)
    │  │  ├── <Exposure_category1>
    │  │  │  └── Resource: <project_name>_<Hazard1>_<Country1>_<Exposure_categoryl>.xlsx  ->  [subtype1.tif; subtype2.tif; subtype3.tif]
    │  │  └── <Exposure_category2>
    │  │     └── Resource: <project_name>_<Hazard1>_<Country1>_<Exposure_category2>.xlsx  ->  [subtype1.tif; subtype2.tif; subtype3.tif]
    └── <Hazard2>
        └── <...>
           └── <...>
Loss data
Format
Loss or impact data comes in the form of:
tabulated event losses, and loss per exceedance probability
mapped return period loss / annual average loss - in vector files/choropleth maps
(more rarely) as granular raster or vector data with loss value attached
Thematic grouping
The main thematic groupings in loss data are:
Hazard type: denoting a single hazard or a multi-hazard loss metric.
Asset type / sector: e.g. Structure, Content, Product / Residential, Commercial
Year or period: e.g. historical (2020), projections (2040-2060), etc.
Geographic grouping
Losses are usually aggregated at national or subnational administrative level (ADM2, ADM1, or ADM0) or for a multi-country region. Losses can also be provided per asset (e.g. individual buildings or raster footprints) but it is not usual, although these files are usually generated by the risk analysts.
Packaging suggest
Depending on the data format and size:
if data consists of one or more tables, it is usually a good idea to group it together into one
excelfile so users can access all of the losses at once;if data consists of one or more vector files representing national or subnational boundary levels, these can be grouped into one
geopackagefile;if data consists of multiple granular spatial data, it might be packed as individual or multiple layers (depending on the size of individual layers)
In either case, we suggest grouping exposure data using the following hierarchy:
Hazard type
Country
Exposure category
Sub-type
Year or period
For example:
<project_name>
 └── Loss
    ├── <Hazard1>
    │  ├── <Country> 	(skip if global function)
    │  │  ├── <Exposure_category1>
    │  │  │  └── Resource: <project_name>_<Hazard1>_<Country1>_<Exposure_categoryl>.xlsx  ->  [subtype1.tif; subtype2.tif; subtype3.tif]; [period]
    │  │  └── <Exposure_category2>
    │  │     └── Resource: <project_name>_<Hazard1>_<Country1>_<Exposure_category2>.xlsx  ->  [subtype1.tif; subtype2.tif; subtype3.tif]; [period]
    └── <Hazard2>
        └── <...>
           └── <...>