Hazard metadata

The hazard component is described as:

Metadata that is specific to datasets that describe natural processes or phenomena that may cause loss of life, injury or other health impacts, property damage, social and economic disruption or environmental degradation.

The hazard component describes metadata about modeled natural hazards data, including hazard intensity footprints of historical or hypothetical events, return period hazard maps, hazard or susceptibility index, and stochastic event sets. The metadata defines the hazard type, physical process and intensity measures used in the dataset. Multiple hazards and processes (including cascading events) can be defined for each hazard, enabling users to describe dataset that contain, for example, earthquake ground shaking and liquefaction, and tsunami inundation triggered by the earthquake.

The hazard component uses hazard type, process type and intensity measure consistent with the vulnerability and loss components of this standard. Spatial reference and location information are described using existing external standards. Temporal information can include date and duration of events or year of scenario, and is defined using the Dublin Core standards.

Overview

            erDiagram
        Direction LR

        Event_set {
            string id*
            object hazard*
            string analysis_type*
        }

        Event {
            string id*
            object hazard*
            string calculation_method*
            string occurrence*
        }    

        Dataset ||--o| "Hazard metadata": "Hazard data described by"
        "Hazard metadata" o|--|{ Event_set: "Describes"
        Event_set o|--|{ "Event": "Contains"
    

Examples

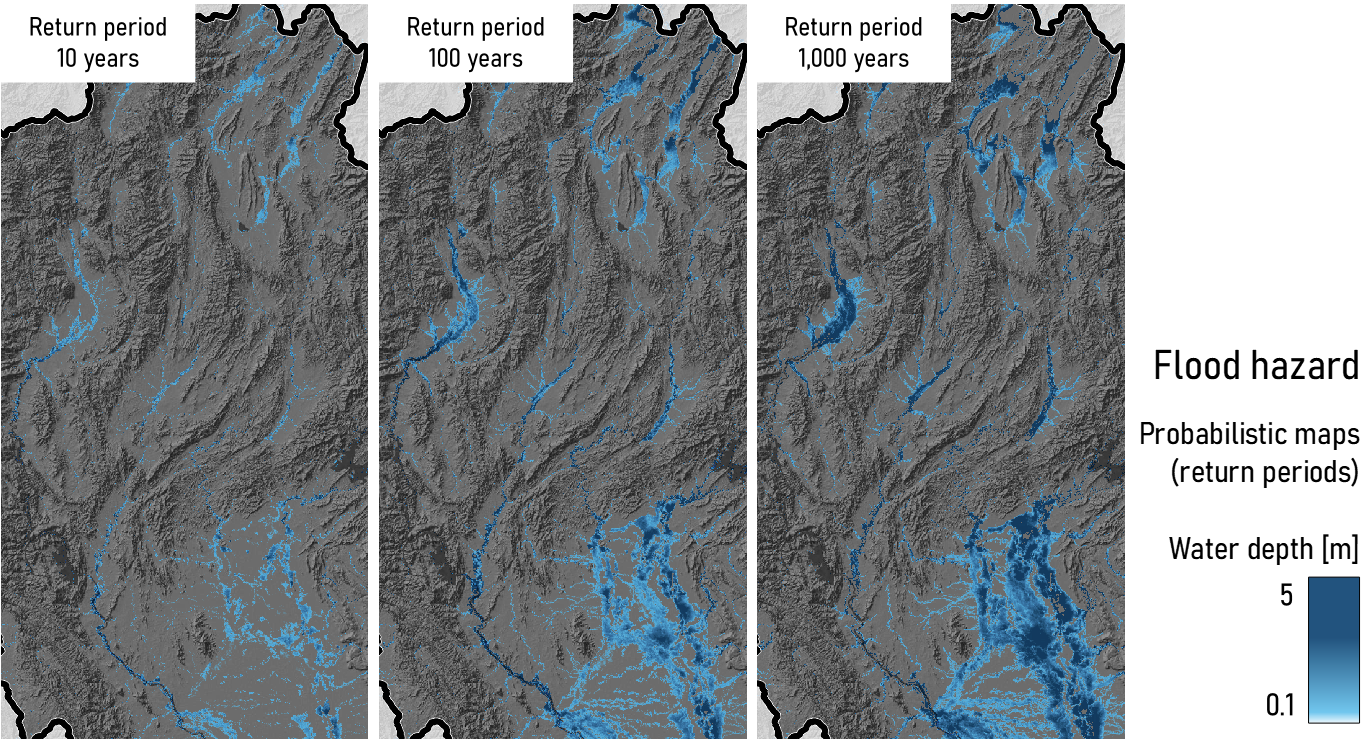
Example: Fathom Global Flood Map

The following example shows RDLS metadata for the Fathom Global Flood Map in JSON format.

../../../_images/figure2.png
{
    "id": "rdls_hzd-F3_FCV",
    "title": "Flood hazard maps for 16 FCV countries",
    "description": "Third release of the probabilistic modelling of fluvial, pluvial and coastal flood hazard developed by Fathom. This selection includes 16 countries among the most vulnerable to climate change, such as Pakistan, Somalia, and Yemen, which often struggle with limited data resources. Under World Bank agreement, Fathom offers free-of-charge access to flood data for these countries for non-commercial use.",
    "risk_data_type": [
        "hazard"
    ],
    "publisher": {
        "name": "Fathom",
        "url": "https://www.fathom.global/"
    },
    "version": "3",
    "purpose": "Fathom Global hazard maps can support risk screening and analysis at the sub-national level. Caution is advised when using these data as the only source of flood hazard information for site-specific analysis. The model is driven by global assumptions; it can provide a useful overview of the likely hazard in a particular area, however local data should be sought out before detailed planning or operational decisions are made. The data are not suitable for engineering-level analysis (such as construction of bridges or flood defences).",
    "details": "The FATHOM flood-hazard model is a global gridded dataset of flood hazard produced at the global scale. It provides flood extent and water depth to ground (in centimeters) for three types of flood phenomena: - Fluvial (or river) flooding occurs when a river exceeds its capacity and inundates surrounding areas. - Pluvial (or surface water) flooding occurs when extreme rainfall exceeds surface drainage capacity. - Coastal flooding occurs when a combination of storm-surge, tides and waves lead to water levels that submerge the coastal land. There are two options for each flood type: Defended and Undefended (fluvial and coastal only). Defended scenarios account for protection standards in proportion to country wealth to reduce the chance of hazard occurrence. It does not take account location-specific physical protection measures. The model covers 4 time periods: - 2020 (present baseline) - 2030 (near future) - 2050 (mid-century) - 2080 (far future) Future periods include 4 model realizations, each one describing a different climate scenario: - SSP1 \u2013 2.6 (limited emissions) - SSP2 \u2013 4.5 - SSP3 \u2013 7.0 - SSP5 \u2013 8.5 (high emissions) Each scenario set is made of 10 events each representing a different intensity and probability of occurrence, expressed as \u201creturn period\u201d. These are framed as 1 in 5, 10, 20, 50, 100, 200, 500 and 1,000 years. ",
    "contact_point": {
        "name": "Mattia Amadio",
        "email": "mamadio@worldbank.org"
    },
    "creator": {
        "name": "SSBN ltd",
        "url": "https://www.fathom.global/"
    },
    "spatial": {
        "scale": "regional",
        "countries": [
            "BFA",
            "BDI",
            "CAF",
            "TCD",
            "COD",
            "DJI",
            "HND",
            "MDG",
            "FSM",
            "MOZ",
            "PAK",
            "PNG",
            "SOM",
            "SSD",
            "TLS",
            "YEM"
        ]
    },
    "spatial_resolution": 30,
    "license": "https://creativecommons.org/licenses/by-nc-nd/4.0/",
    "resources": [
        {
            "title": " Fathom v3 FCV countries request",
            "description": "Request form to access Fathom Flood Hazard Maps for 16 FCV countries. ",
            "access_url": "https://forms.office.com/r/u55iJgeZGU",
            "media_type": "image/tiff;application=geotiff",
            "spatial": {
                "scale": "national",
                "countries": [
                    "BFA",
                    "BDI",
                    "CAF",
                    "TCD",
                    "COD",
                    "DJI",
                    "HND",
                    "MDG",
                    "FSM",
                    "MOZ",
                    "PAK",
                    "PNG",
                    "SOM",
                    "SSD",
                    "TLS",
                    "YEM"
                ]
            },
            "baseline_period": {
                "central_year": 2020
            },
            "id": "resource_cDAPBUUC"
        }
    ],
    "hazard": {
        "event_sets": [
            {
                "hazards": [
                    {
                        "id": "hazard_mSn26wkr",
                        "type": "flood",
                        "process": "fluvial_flood",
                        "intensity_measure": "flow_depth_ground:cm"
                    },
                    {
                        "id": "hazard_G9F82lIQ",
                        "type": "flood",
                        "process": "pluvial_flood",
                        "intensity_measure": "flow_depth_ground:cm"
                    },
                    {
                        "id": "hazard_1c9SyLRK",
                        "type": "flood",
                        "process": "coastal_flood",
                        "intensity_measure": "flow_depth_ground:cm"
                    }
                ],
                "analysis_type": "probabilistic",
                "frequency_distribution": "generalized_extreme_value",
                "calculation_method": "simulated",
                "occurrence_range": "1/10 to 1/1000 years ",
                "id": "event_set_JGsFpd1d"
            }
        ]
    },
    "links": [
        {
            "href": "https://docs.riskdatalibrary.org/en/1__0__0/rdls_schema.json",
            "rel": "describedby"
        }
    ]
}
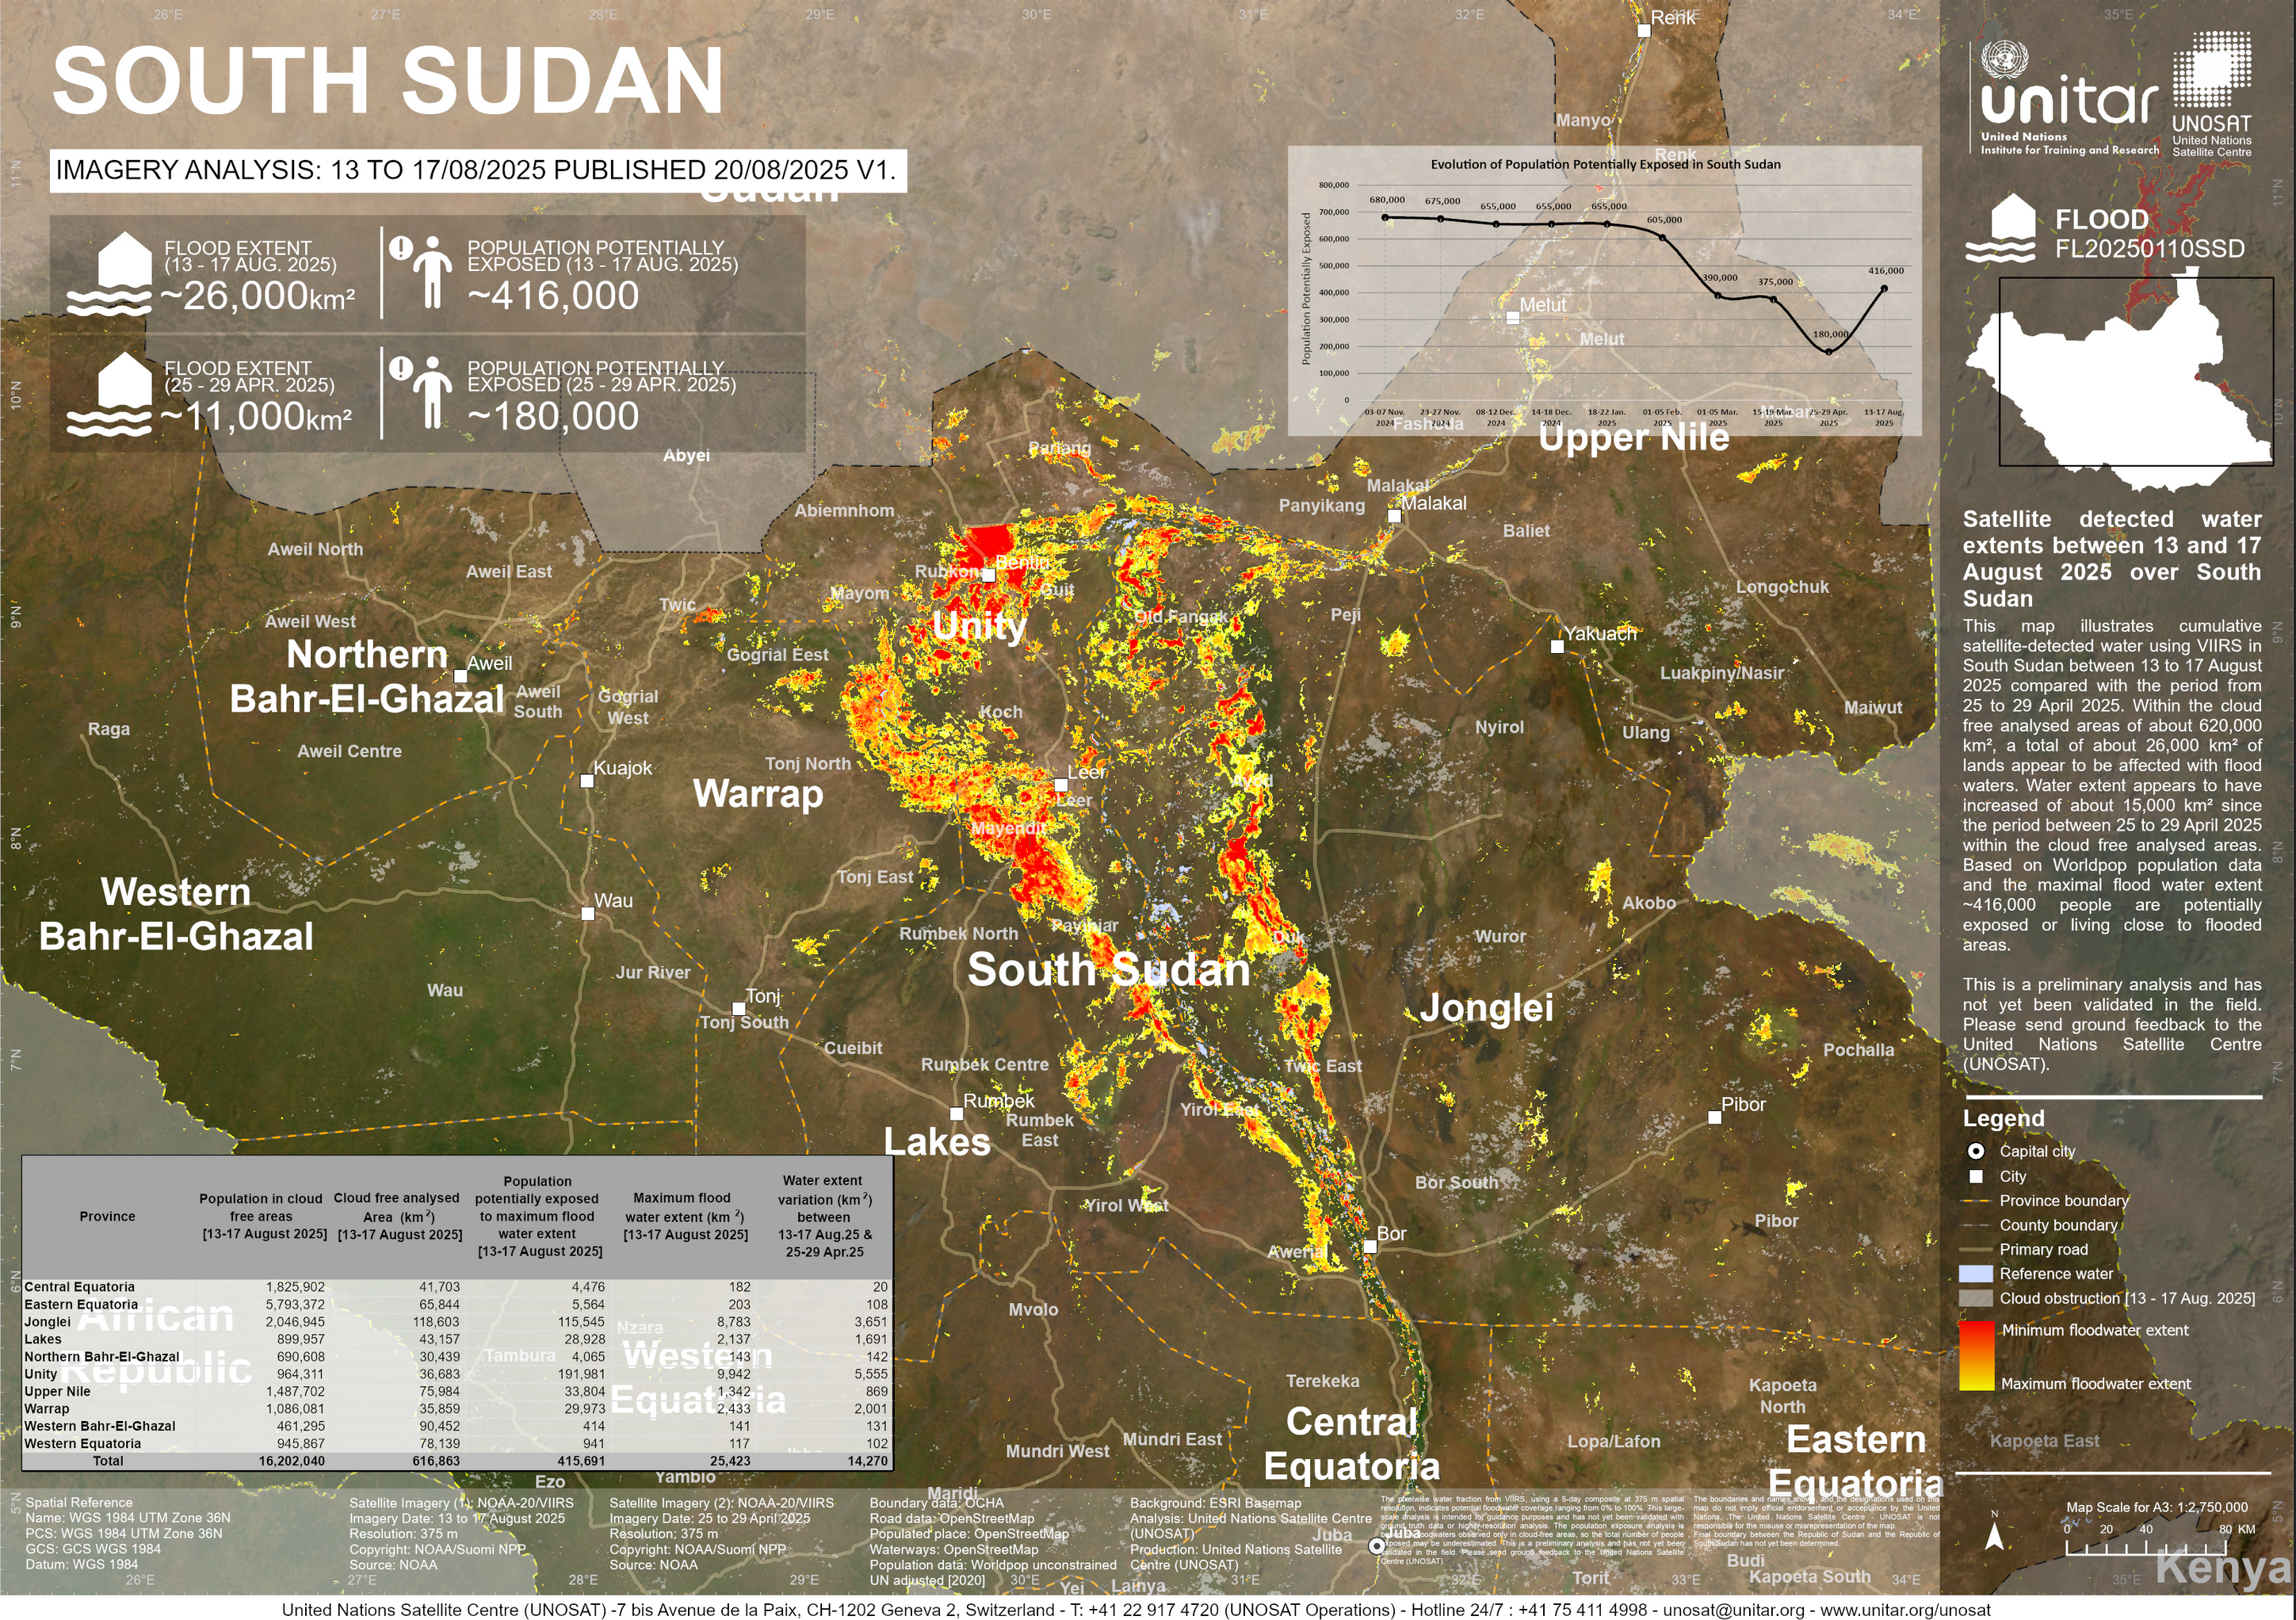
Example: UNOSAT Flood event in SSD

The following example shows RDLS metadata for the UNOSAT Flood event in SSD in JSON format.

../../../_images/figure3.png
{
    "id": "rdls_hzd-SSD_dataset",
    "title": "Satellite detected water extents between 13 and 17 August 2025 over South Sudan",
    "description": "This map illustrates cumulative satellite-detected water using VIIRS in South Sudan between 13 to 17 August 2025, compared with the period from 25 to 29 April 2025. Within the cloud-free analysed areas of about 620,000 km\u00b2, a total of about 26,000 km\u00b2 of land appears to be affected by flood waters. Water extent appears to have increased of about 15,000 km\u00b2 since the period between 25 to 29 April 2025 within the cloud-free analysed areas. Based on Worldpop population data and the maximal flood water extent ~416,000 people are potentially exposed or living close to flooded areas. This is a preliminary analysis and has not yet been validated in the field. Please send ground feedback to the United Nations Satellite Centre (UNOSAT).",
    "risk_data_type": [
        "hazard"
    ],
    "publisher": {
        "name": "UNOSAT",
        "email": "emergencymapping@unosat.org",
        "url": "https://unosat.org/"
    },
    "contact_point": {
        "name": "UNOSAT",
        "email": "emergencymapping@unosat.org",
        "url": "https://unosat.org/"
    },
    "creator": {
        "name": "UNOSAT",
        "email": "emergencymapping@unosat.org",
        "url": "https://unosat.org/"
    },
    "spatial": {
        "scale": "national",
        "countries": [
            "SSD"
        ]
    },
    "spatial_resolution": 375,
    "temporal": {
        "start": "2025-08-13",
        "end": "2025-08-17",
        "duration": "P5D"
    },
    "license": "https://creativecommons.org/licenses/by/4.0/",
    "referenced_by": [
        {
            "name": "UNOSAT",
            "date_published": "2025-08-20",
            "url": "https://unosat.org/products/4174",
            "id": "reference_h1CBlqBs"
        }
    ],
    "resources": [
        {
            "title": "Satellite detected water extents between 13 and 17 August 2025 over South Sudan",
            "description": "Pdf report",
            "download_url": "https://unosat.org/static/unosat_filesystem/4174/UNOSAT_A3_Natural_Landscape_FL20250110SSD_13Aug_17Aug2025_SouthSudan_Week38.pdf",
            "media_type": "application/pdf",
            "spatial": {
                "scale": "national",
                "countries": [
                    "SSD"
                ]
            },
            "id": "resource_BKFdFrar"
        },
        {
            "title": "Satellite detected water extents between 13 and 17 August 2025 over South Sudan",
            "description": "Map data as geodatabase",
            "download_url": "https://unosat.org/static/unosat_filesystem/4174/FL20220424SSD_gdb.zip",
            "media_type": "application/x-filegdb",
            "spatial": {
                "scale": "national",
                "countries": [
                    "SSD"
                ]
            },
            "id": "resource_w6NBAvrk"
        },
        {
            "title": "Satellite detected water extents between 13 and 17 August 2025 over South Sudan",
            "description": "Map data as shapefile.",
            "download_url": "https://unosat.org/static/unosat_filesystem/4174/FL20220424SSD_SHP.zip",
            "media_type": "application/vnd.shp",
            "spatial": {
                "scale": "national",
                "countries": [
                    "SSD"
                ]
            },
            "id": "resource_rFavBRsN"
        },
        {
            "title": "Satellite detected water extents between 13 and 17 August 2025 over South Sudan",
            "description": "Tabular data as excel file.",
            "download_url": "https://unosat.org/static//unosat_filesystem/4174/UNOSAT_Population_Exposure_FL20250110SSD_13Aug_17Aug2025_SouthSudan_Week38.xlsx",
            "media_type": "application/vnd.openxmlformats-officedocument.spreadsheetml.sheet,Excel (xlsx)",
            "spatial": {
                "scale": "national",
                "countries": [
                    "SSD"
                ]
            },
            "id": "resource_LnChc3yl"
        },
        {
            "title": "Satellite detected water extents between 13 and 17 August 2025 over South Sudan",
            "description": "Interactive geodashboard.",
            "access_url": "https://unosat.maps.arcgis.com/apps/dashboards/b3c40fc3e6ec46668b26019db0b11f7c",
            "media_type": "text/html",
            "spatial": {
                "scale": "national",
                "countries": [
                    "SSD"
                ]
            },
            "id": "resource_qO1qZSIY"
        }
    ],
    "hazard": {
        "event_sets": [
            {
                "hazards": [
                    {
                        "id": "hazard_cRcsPC3N",
                        "classification": {
                            "id": "item_3xOTuoMe"
                        },
                        "type": "flood",
                        "process": "fluvial_flood",
                        "intensity_measure": "affected_area:km2"
                    }
                ],
                "events": [
                    {
                        "id": "event_0OVTePH3",
                        "calculation_method": "inferred",
                        "hazard": {
                            "id": "hazard_cRcsPC3N",
                            "type": "flood",
                            "process": "fluvial_flood",
                            "intensity_measure": "affected_area:km2"
                        },
                        "occurrence": {
                            "empirical": {
                                "temporal": {
                                    "start": "2025-08-13",
                                    "end": "2025-08-17",
                                    "duration": "P5D"
                                }
                            }
                        }
                    }
                ],
                "disaster_identifiers": [
                    {
                        "id": "item_OyKerPgs",
                        "uri": "FL20250110SSD",
                        "scheme": "GLIDE"
                    }
                ],
                "analysis_type": "empirical",
                "calculation_method": "inferred",
                "id": "event_set_n2b2nKAw"
            }
        ]
    },
    "links": [
        {
            "href": "https://docs.riskdatalibrary.org/en/1__0__0/rdls_schema.json",
            "rel": "describedby"
        }
    ]
}

Properties

Title

Description

Type

Format

Required

event_sets

array[Event set]

Required

Event sets

Information about sets of hazard events.

See Event set

Event set

            erDiagram
        Direction LR

        Event_set {
            string id*
            string analysis_type*
        }

        "Hazard metadata" |o--|{ Event_set: "Describes"
        Event_set ||--|{ "Hazard": "Includes"
        Event_set o|--|{ "Event": "Includes"
    

Title

Description

Type

Format

Required

id

string

Required

Event set identifier

A locally unique identifier for this event set.

hazards

array[Hazard]

Required

Hazards

The hazards included in this event set.

See Hazard

analysis_type

string

Required

Analysis type

The type of analysis used by the hazard model, from the closed analysis type codelist.

frequency_distribution

string

Frequency distribution

The frequency distribution assumed for the occurrence of events over a multi-year timeline, from the frequency_distribution codelist.

seasonality

string

Seasonality distribution

The seasonality distribution assumed for the occurrence of events across a calendar year, from the seasonality_distribution codelist

calculation_method

string

Calculation Method

The methodology used for the calculation of the event set in the modelled scenario(s), taken from the closed data_calculation_type codelist.

event_count

number

Event count

The number of events contained in the event set. You should only use this field when details of individual events are not included in the RDLS metadata.

occurrence_range

string

Occurrence range

A summary of the probabilistic occurrence scenarios that are included in the event set. You should only use this field when event_set.analysis_type = ‘probabilistic’

events

array[Event]

Events

The events in this event set. Use this section to specify individual events features that differ from the main event set.

See Event

Event

            erDiagram
        Direction LR

        Event {
            string id*
            string calculation_method*
            object hazard*
            object occurrence*
        }

        "Event_set" |o--o{ Event: "Includes"
    

Title

Description

Type

Format

Required

id

string

Required

Event identifier

A locally unique identifier for this event.

disaster_identifiers

array[Classification]

Disaster identifiers

Identifiers for the disaster to which this event relates.

disaster_identifiers/0/scheme

string

Scheme

The scheme or codelist from which the classification code is taken, using the open classification_scheme codelist.

disaster_identifiers/0/id

string

Required

Classification identifier

The classification code taken from the scheme.

disaster_identifiers/0/title

string

Title

A title for the classification code.

disaster_identifiers/0/description

string

Description

A description for the classification code.

disaster_identifiers/0/uri

string

iri

URI

A URI to uniquely identify the classification code.

calculation_method

string

Required

Model calculation method

The methodology used for the calculation of the event in the modelled scenario(s), from the closed data calculation type codelist.

hazard

object

Required

Hazard

The hazard to which this event relates.

See Hazard

occurrence

object

Required

Occurrence

The frequency or likelihood of the event happening within a given time frame.

occurrence/probabilistic

object

Probabilistic frequency

How often the event is expected to occur. Can be return period and/or probability. Both fields are provided to allow entry of return period (most common term used across all hazards) and/or probability, which is commonly used for seismic hazard. Probability commonly refers to a probability within 1 year or 50 years, but may be relative to any duration - when probability is used, span must be specified. This object must only be used if event_set.analysis_type = ‘probabilistic’

occurrence/probabilistic/return_period

number

Return period

The event return period (or recurrence interval); the estimated average time between events. Expressed as the denominator of ‘1/n’, e.g. ‘10’ for a 1-in-10 year return period etc.

occurrence/probabilistic/event_rate

number

Event rate

The average number of occurrences of the event within a given year. This is the reciprocal of the return period, related by event_set.frequency_distribution.

occurrence/probabilistic/probability

object

Probability

The likelihood of the event occurring in a given time period.

occurrence/probabilistic/probability/value

number

Probability value

The probability of the event occurring during the time period specified in .span, expressed as a number between 0 and 1, e.g. 0.1 represents a 10% likelihood of the event occurring.

occurrence/probabilistic/probability/span

number

Required

Probability span

The length in years of the period in which the event is likely to occur with the probability specified in .value.

occurrence/empirical

object

Empirical

The period of time over which the event occurred and the associated return period (if any). You should only use this object when event_set.analysis_type = ‘empirical’

occurrence/empirical/temporal

object

Temporal occurrence

The period of time over which the event occurred.

occurrence/empirical/temporal/start

string

Start

The start of the period. A date (YYYY-MM-DD) is recommended. However, year-months (YYYY-MM) and years (YYYY) are supported.

occurrence/empirical/temporal/end

string

End date

The end of the period. A date (YYYY-MM-DD) is recommended. However, year-months (YYYY-MM) and years (YYYY) are supported.

occurrence/empirical/temporal/duration

string

duration

Duration

The duration of the period in ISO 8601 duration format, e.g. ‘P50Y’ for 50 years

occurrence/empirical/temporal/central_year

integer

Central year

The central or representative year as a single point in time rather than a period (e.g., ‘2050’ representing the period 2040-2060). Use this instead of start/end when data represents conditions centered on a specific year.

occurrence/empirical/return_period

number

Associated return period

Probabilistic frequency estimate associated with the empirical events in terms of hazard intensity. Expressed as the denominator of ‘1/n’, e.g. ‘10’ for a 1-in-10 year return period etc.

occurrence/deterministic

object

Deterministic frequency

The index criteria and thresholds classification used by the deterministic event set, index approaches and susceptibility data. You should only use this object when event_set.analysis_type = ‘deterministic’.

occurrence/deterministic/index_criteria

string

Index criteria

Full description of the approach and criteria used to produce the index value. A deterministic hazard intensity index (ranking, score, etc) is not tied to a specific occurrence probability, rather is produced using an aggregation criteria (e.g. max, mean, median of annual values over a period; multi-criteria combination; Principal Component Analysis; else).

occurrence/deterministic/thresholds

array[string]

Index thresholds

The thresholds used to classify the index value. Each threshold should be a separate item. Where thresholds are identified by both a number and a descriptor, include the descriptor in brackets, e.g. 1 (low).

description

string

Description

Provides additional information about this specific event

Hazard

Title

Description

Type

Format

Required

type

string

Required

Type

The type of the hazard, from the closed hazard type codelist.

process

string

Required

Process

The process that resulted in the hazard, from the closed hazard process type codelist.

intensity_measure

string

Required

Intensity measure

The metric and unit in which the intensity of this hazard is measured, from the open intensity measure codelist for the hazard type.

classification

object

Classification

A classification of the hazard type against an external taxonomy such as the UNDRR Hazard Information Profiles.

classification/scheme

string

Scheme

The scheme or codelist from which the classification code is taken, using the open classification_scheme codelist.

classification/id

string

Required

Classification identifier

The classification code taken from the scheme.

classification/title

string

Title

A title for the classification code.

classification/description

string

Description

A description for the classification code.

classification/uri

string

iri

URI

A URI to uniquely identify the classification code.

trigger

object

Trigger

The cause of this hazard.

trigger/type

string

Required

Type

The type of the hazard, from the closed hazard type codelist.

trigger/process

string

Process

The process that resulted in the hazard, from the closed hazard process type codelist.

id

string

Required

Hazard identifier

A local identifier for this hazard.